Assessing Read Quality
Overview
Questions
- How can I describe the quality of my data?
Objectives
Explain how a FASTQ file encodes per-base quality scores.
Interpret a FastQC plot summarizing per-base quality across all reads.
Use
forloops to automate operations on multiple files.How to use multiqc to make web based summary file for QC metrics
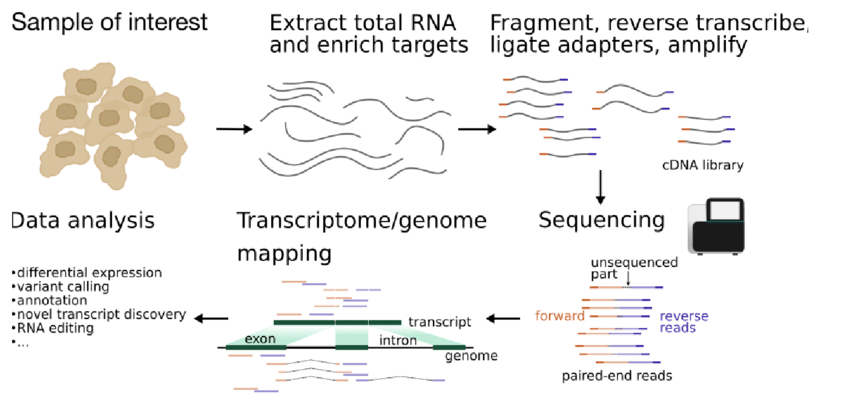
Bioinformatic workflows
When working with high-throughput sequencing data, the raw reads you get off of the sequencer will need to pass through a number of different tools in order to generate your final desired output. The execution of this set of tools in a specified order is commonly referred to as a workflow or a pipeline.
An example of the workflow we will be using for our variant calling analysis is provided below with a brief description of each step.

- Quality control - Assessing quality using FastQC
- Quality control - Trimming and/or filtering reads (if necessary)
- Align reads to reference genome
- Perform post-alignment clean-up
- Variant calling
Standard data formats are essential and used throughout bioinfomatics.
Starting with data
Ramaciotti Centre for Genomics and other sequencing centers will usually provide you will a link for data download. Today we will be working with publicly available sequencing data. However, we are using data that has been dowloaded onto the cluster beforehand, and split by chromosome to make it less computationally demanding to run through the entire pipeline.
You will be utilising one of the datasets from: https://theheking.github.io/babs-rna-seq-2024/practical_overview/sample_datasets/ For each dataset, there is a control and disease condition. I am using the dataset below and analysing the differential expression between cerebellum and heart human datasets.
| Description | Website GSE | Paper | Paper Website | Control Sample | Test Sample | |
|---|---|---|---|---|---|---|
| Human tissues | A data looking at the evolution of gene expression levels in mammalian organs | https://www.ncbi.nlm.nih.gov/geo/query/acc.cgi?acc=GSE30352 | The evolution of gene expression levels in mammalian organs | https://www.nature.com/articles/nature10532 | Cerebellum | Heart |
The data is single-end sequenced.
Recap
What is the difference between single and paired-end reads?
With paired-end sequencing, both ends of the fragment are sequenced. With single-end sequencing, only one end of a fragment is sequenced. If the data is paired-end, you have two files for each sample.
Question
When would the paired-ness occur in the wetlab protocol?
You will find your FASTQ files at /srv/scratch/babs3291/. You will be assigned a chromosome subset and a dataset previously.
To download the data, please:
1) request an interactive session using qsub. Notice where you are right now using pwd.
$ qsub -I
2) Use mkdir to create a folder to store all your projects.
$ mkdir /srv/scratch/zID/babs3291
3) Use mkdir to create a folder for your input fasta file e.g. untrimmed_fastq
You can use the -p option for mkdir. This option allows mkdir to create the new directory, even if one of the parent directories does not already exist. It also supresses errors if the directory already exists, without overwriting that directory.
        $ mkdir -p /srv/scratch/zID/babs3291/untrimmed_fastq
        $ cd /srv/scratch/zID/babs3291/untrimmed_fastq
5) copy your dataset from the /srv/scratch/babs3291/ to this directory as below.
Important for your unique download
$ GSE="GSE30352"
$ CHROMOSOME="chr1_chr3"
$ scp /srv/scratch/babs3291/${GSE}/*${CHROMOSOME}*fastq.gz .
This command creates a copy of each of the files in the directory that end in
fastq.gzand places the copies in the current working directory (signified by.).
The data comes in a compressed format, which is why there is a .gz at the end of the file names. This makes it faster to transfer and allows it to take up less space on our computer. To unzip one of the files - you can look at the fastq format.
$ gunzip SRR2584863_1.fastq.gz #do not do this!!!
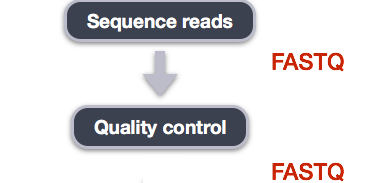
Quality control
We will now assess the quality of the sequence reads contained in our fastq files.
Details on the FASTQ format
Although it looks complicated (and it is), we can understand the fastq format with a little decoding. Some rules about the format include…
Line - Description
1 - Always begins with ‘@’ and then information about the read
2 - The actual DNA sequence
3 - Always begins with a ‘+’ and sometimes the same info in line 1
4 - Has a string of characters which represent the quality scores; must have same number of characters as line 2 found in more detail
We can view the first complete read in one of the files our dataset by using head to look at the first four lines.
$ zcat Adapter_SRR306844chr1_chr3.fastq.gz | head -n 4
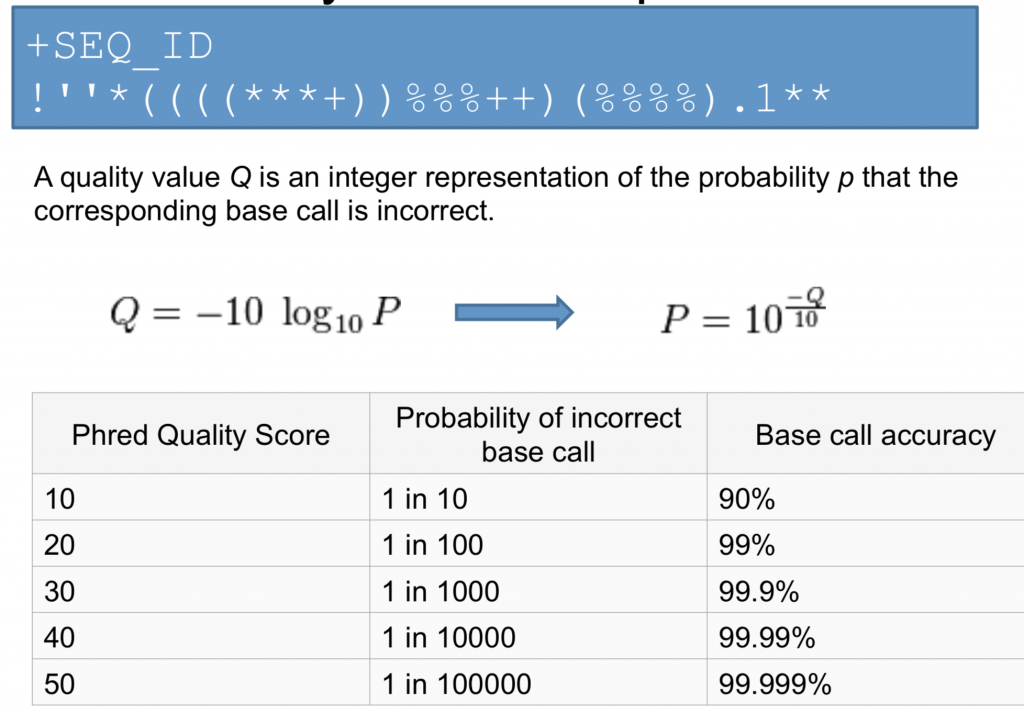
Line 4 shows the quality for each nucleotide in the read. Quality is interpreted as the probability of an incorrect base call (e.g. 1 in 10) or, equivalently, the base call accuracy (e.g. 90%). To make it possible to line up each individual nucleotide with its quality score, the numerical score is converted into a code where each individual character represents the numerical quality score for an individual nucleotide. For example, in the line above, the quality score line is:
!69699><;;:8=+:::::987765979858859775775883796699+487895998785922743628431112.-,-0/22201/05006+*,/.-1-3/-31--3
The numerical value assigned to each of these characters depends on the sequencing platform that generated the reads. The sequencing machine used to generate our data uses the standard Sanger quality PHRED score encoding, using Illumina version 1.8 onwards. Each character is assigned a quality score between 0 and 41 as shown in the chart below.
Quality encoding: !"#$%&'()*+,-./0123456789:;<=>@ABCDEFGHI
                   |        |         |        |        |
Quality score:    01..... ..11.......20........30.......40
Each quality score represents the probability that the corresponding nucleotide call is incorrect. This quality score is logarithmically based, so a quality score of 10 reflects a base call accuracy of 90%, but a quality score of 20 reflects a base call accuracy of 99%. These probability values are the results from the base calling algorithm and depend on how much signal was captured for the base incorporation.
Looking back at our read:
     @SRR306844.16.1
     NTGTAAATGAGTGAGGCAGGAGTCCGAGGAGGTTAGTTGTGGCAATAAAAATGATTAAGGATACTAGTATAAGAGAAGATCGGAAGAGCGTCGTGTAGGGAAAGAGTGTA
     +
     !69699><;;:8=+:::::987765979858859775775883796699+487895998785922743628431112.-,-0/22201/05006+*,/.-1-3/-31--3
we can now see that there is a range of quality scores but that the beginning of the sequence is very poor (! = a quality score of 1).
Exercise
What is the last read in your file? Is this read of high quality, explain? Hint: use command:
tailYou will often see bioinformaticians use FASTQ and FASTA interchangeably. What is the difference between FASTQ and FASTA files?
Loading a new function
Try and run fastqc to see if it is available, if not we will “load” it for your user.
$ fastqc
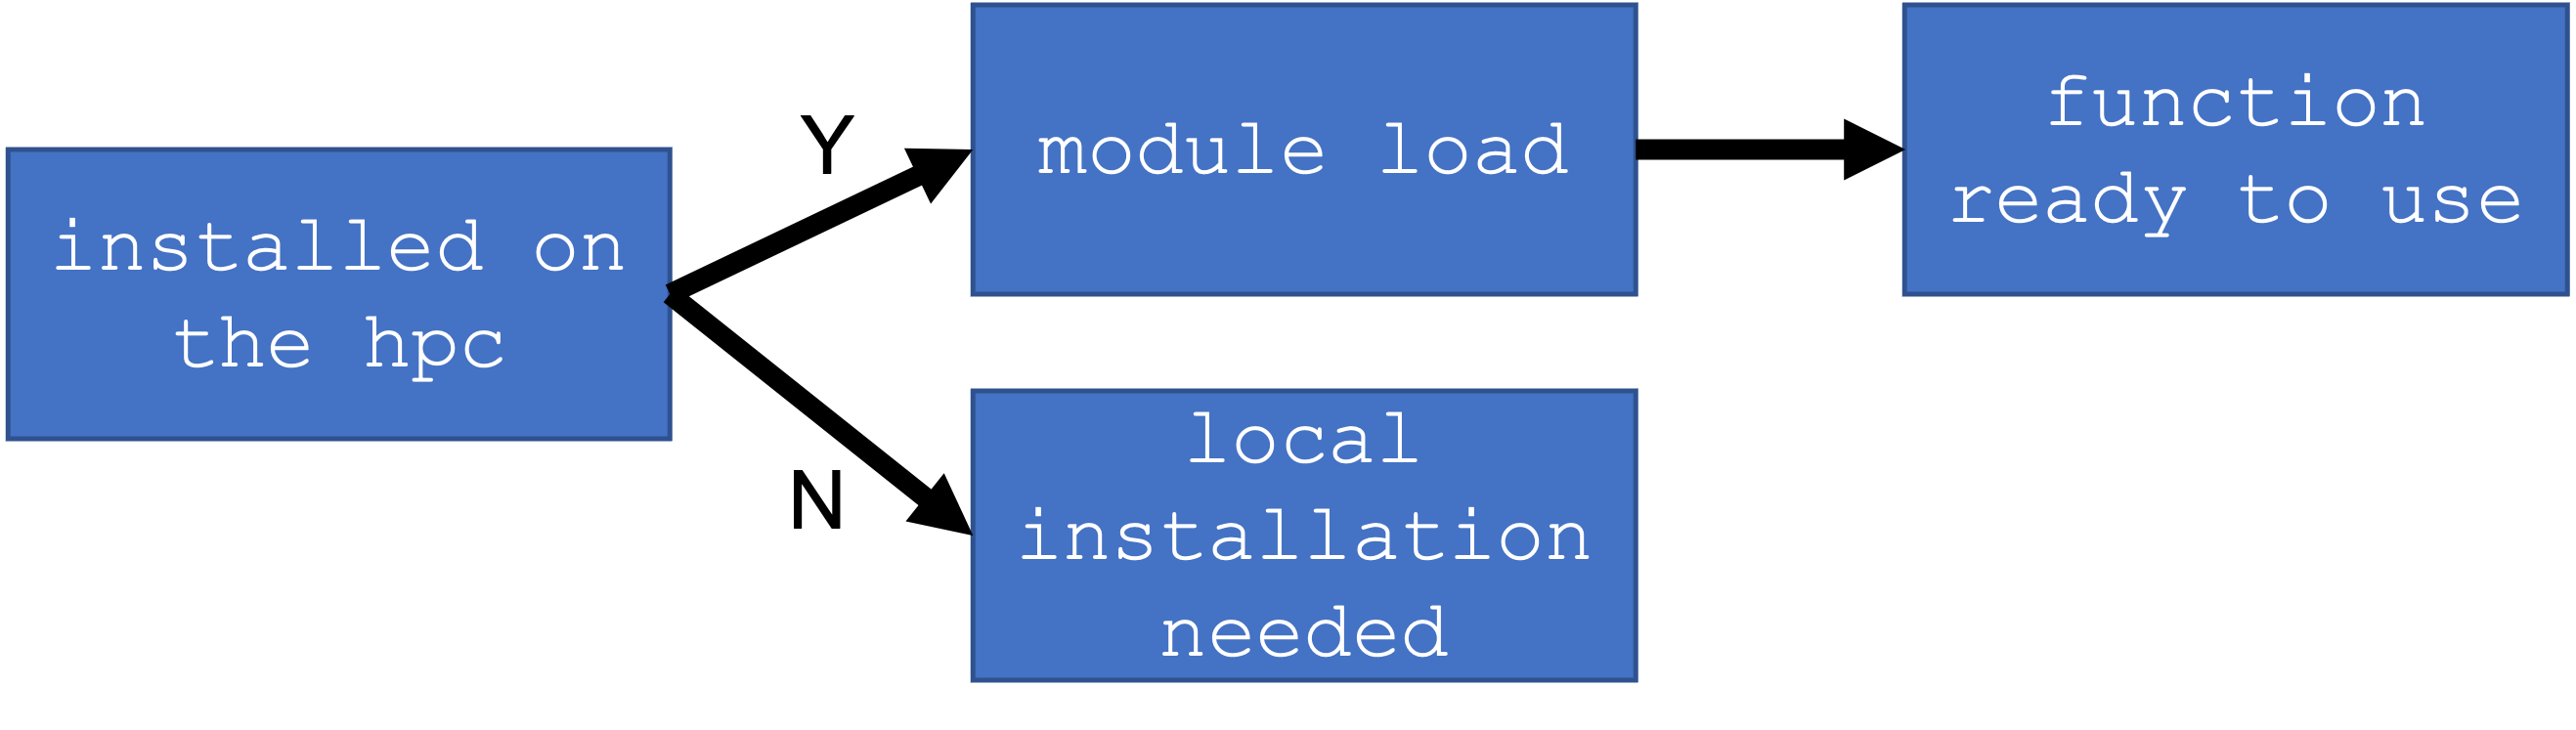
You will not be asked to install any packages in this course. However, the functions will be available through a main installation, but you need to modify your local environment so your computer know exactly where the main installation is.
$ module avail
To find modules of interest, you can use the grep command to filter out a string. E.g. any package with “t”
$ module avail | grep t
To load the function. You need
$ module load fastqc
Exercise
Which function would you use to filter the output of module avail to show only output with keyword “fastq” ?
$ fastqc -h
            FastQC - A high throughput sequence QC analysis tool

SYNOPSIS

        fastqc seqfile1 seqfile2 .. seqfileN

    fastqc [-o output dir] [--(no)extract] [-f fastq|bam|sam]
           [-c contaminant file] seqfile1 .. seqfileN

DESCRIPTION

    FastQC reads a set of sequence files and produces from each one a quality
    control report consisting of a number of different modules, each one of
    which will help to identify a different potential type of problem in your
    data.

    If no files to process are specified on the command line then the program
    will start as an interactive graphical application.  If files are provided
    on the command line then the program will run with no user interaction
    required.  In this mode it is suitable for inclusion into a standardised
    analysis pipeline.

    The options for the program as as follows:

    -h --help       Print this help file and exit

    -v --version    Print the version of the program and exit

    -o --outdir     Create all output files in the specified output directory.
                    Please note that this directory must exist as the program
                    will not create it.  If this option is not set then the
                    output file for each sequence file is created in the same
                    directory as the sequence file which was processed.

    --casava        Files come from raw casava output. Files in the same sample
                    group (differing only by the group number) will be analysed
                    as a set rather than individually. Sequences with the filter
                    flag set in the header will be excluded from the analysis.
                    Files must have the same names given to them by casava
                    (including being gzipped and ending with .gz) otherwise they
                    will not be grouped together correctly.

    --nano          Files come from naopore sequences and are in fast5 format. In
                    this mode you can pass in directories to process and the program
                    will take in all fast5 files within those directories and produce
                    a single output file from the sequences found in all files.

    --nofilter      If running with --casava then don't remove read flagged by
                    casava as poor quality when performing the QC analysis.

    --extract       If set then the zipped output file will be uncompressed in
                    the same directory after it has been created.  By default
                    this option will be set if fastqc is run in non-interactive
                    mode.

    -j --java       Provides the full path to the java binary you want to use to
                    launch fastqc. If not supplied then java is assumed to be in
                    your path.

    --noextract     Do not uncompress the output file after creating it.  You
                    should set this option if you do not wish to uncompress
                    the output when running in non-interactive mode.

    --nogroup       Disable grouping of bases for reads >50bp. All reports will
                    show data for every base in the read.  WARNING: Using this
                    option will cause fastqc to crash and burn if you use it on
                    really long reads, and your plots may end up a ridiculous size.
                    You have been warned!

    -f --format     Bypasses the normal sequence file format detection and
                    forces the program to use the specified format.  Valid
                    formats are bam,sam,bam_mapped,sam_mapped and fastq

    -t --threads    Specifies the number of files which can be processed
                    simultaneously.  Each thread will be allocated 250MB of
                    memory so you shouldn't run more threads than your
                    available memory will cope with, and not more than
                    6 threads on a 32 bit machine

    -c              Specifies a non-default file which contains the list of
    --contaminants  contaminants to screen overrepresented sequences against.
                    The file must contain sets of named contaminants in the
                    form name[tab]sequence.  Lines prefixed with a hash will
                    be ignored.

    -a              Specifies a non-default file which contains the list of
    --adapters      adapter sequences which will be explicity searched against
                    the library. The file must contain sets of named adapters
                    in the form name[tab]sequence.  Lines prefixed with a hash
                    will be ignored.

    -l              Specifies a non-default file which contains a set of criteria
    --limits        which will be used to determine the warn/error limits for the
                    various modules.  This file can also be used to selectively
                    remove some modules from the output all together.  The format
                    needs to mirror the default limits.txt file found in the
                    Configuration folder.

   -k --kmers       Specifies the length of Kmer to look for in the Kmer content
                    module. Specified Kmer length must be between 2 and 10. Default
                    length is 7 if not specified.

   -q --quiet       Supress all progress messages on stdout and only report errors.

   -d --dir         Selects a directory to be used for temporary files written when
                    generating report images. Defaults to system temp directory if
                    not specified.

BUGS

    Any bugs in fastqc should be reported either to [email protected]
    or in www.bioinformatics.babraham.ac.uk/bugzilla/
Assessing quality using FastQC
In real life, you will not be assessing the quality of your reads by visually inspecting your FASTQ files. Rather, you will be using a software program to assess read quality and filter out poor quality reads. We will first use a program called FastQC to visualize the quality of our reads. Later in our workflow, we will use another program to filter out poor quality reads.
FastQC has several features which can give you a quick impression of any problems your data may have, so you can consider these issues before moving forward with your analyses. Rather than looking at quality scores for each individual read, FastQC takes a subsample of the reads within the sample (the first 10,0000). The image below shows one FastQC-generated plot that indicates a very high-quality sample:
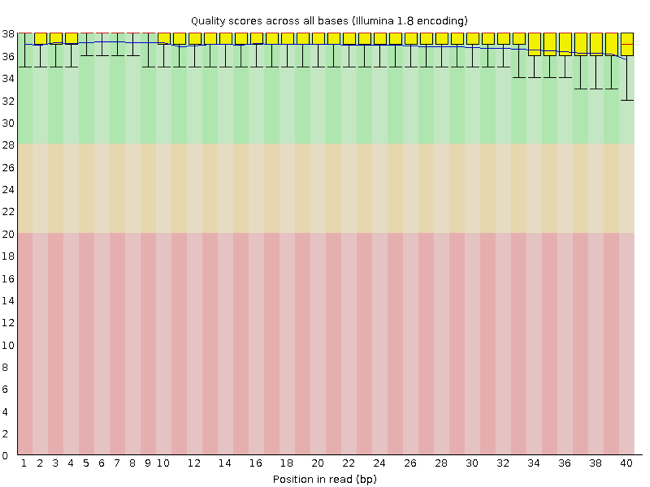
The x-axis displays the base position in the read, and the y-axis shows quality scores. In this example, the sample contains reads that are 40 bp long. This is much shorter than the reads we are working with in our workflow. For each position, there is a box-and-whisker plot showing the distribution of quality scores for all reads at that position. The horizontal red line indicates the median quality score and the yellow box shows the 1st to 3rd quartile range. This means that 50% of reads have a quality score that falls within the range of the yellow box at that position. The whiskers show the absolute range, which covers the lowest (10th percentile) to highest (90th percentile) values.
For each position in this sample, the quality values do not drop much lower than 32. This is a high quality score. The plot background is also color-coded to identify good (green), acceptable (yellow), and bad (red) quality scores.
Now let’s take a look at a quality plot on the other end of the spectrum.
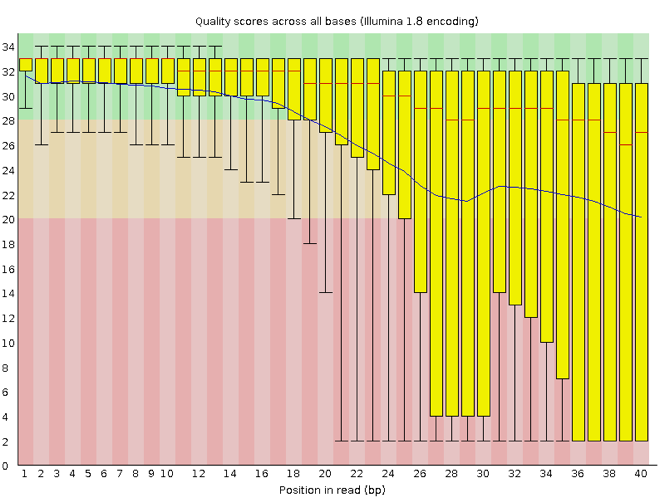
Here, we see positions within the read in which the boxes span a much wider range. Also, quality scores drop quite low into the “bad” range, particularly on the tail end of the reads. The FastQC tool produces several other diagnostic plots to assess sample quality, in addition to the one plotted above.
Running FastQC
We will now assess the quality of the reads that we downloaded. First, make sure you are still in the untrimmed_fastq directory
$ cd /srv/scratch/zID/untrimmed_fastq/
Exercise
How big are your files? (Hint: Look at the options for the
lscommand to see how to show file sizes.)
FastQC can accept multiple file names as input, and on both zipped and unzipped files, so we can use the *.fastq* wildcard to run FastQC on all of the FASTQ files in this directory.
$ fastqc *.fastq*
You will see an automatically updating output message telling you the progress of the analysis. It will start like this:
Started analysis of Adapter_SRR306844chr1_chr3.fastq.gz
Approx 5% complete for Adapter_SRR306844chr1_chr3.fastq.gz
Approx 10% complete for Adapter_SRR306844chr1_chr3.fastq.gz
Approx 15% complete for Adapter_SRR306844chr1_chr3.fastq.gz
The FastQC program has created several new files within our /untrimmed_fastq/ directory.
$ ls
For each input FASTQ file, FastQC has created a .zip file and a
.html file. The .zip file extension indicates that this is actually a compressed set of multiple output files. We will be working with these output files soon. The .html file is a stable webpage displaying the summary report for each of our samples.
We want to keep our data files and our results files separate, so we will move these output files into a new directory within our results/ directory.
$ mkdir -p /srv/scratch/zID/fastqc_untrimmed_reads
$ mv *.zip /srv/scratch/zID/fastqc_untrimmed_reads/
$ mv *.html /srv/scratch/zID/fastqc_untrimmed_reads/
Now we can navigate into this results directory and do some closer inspection of our output files.
$ cd /srv/scratch/zID/fastqc_untrimmed_reads/
Viewing the FastQC results
If we were working on our local computers, we would be able to look at each of these HTML files by opening them in a web browser. However, to look at a summary version of the Fastqc html files- we need to create a summary file.
However, these files are currently sitting on Katana, where our local computer can not see them. And, since we are only logging into the Katana via the command line - it does not have any web browser setup to display these files either.
So the easiest way to look at these webpage summary reports will be to transfer them to our local computers (i.e. your laptop).
To transfer a file from a remote server to our own machines, we will use scp.
First, we will make a new directory on our computer to store the HTML files we are transferring. Let’s put it on our desktop for now. Open a new tab in your terminal program (you can use the pull-down menu at the top of your screen or the Cmd+t keyboard shortcut) and type:
$ mkdir -p ~/Desktop/fastqc_html
Now we can transfer our HTML files to our local computer.
1) Check if you have a Mac/Linux operating system or Windows operating system. 2) Open a new terminal/putty window where you are NOT logged into Katana
For a Mac/Linux OS:
3) Navigate into a known location, e.g. Desktop, with the cd command.
For a Windows OS:
3) Navigate into a known location with the equivalent command as cd which is pushd or popd
4) Using scp to move some infomation from scratch to your local computer.
$ scp zID@katana.restech.unsw.edu.au:"/srv/scratch/zID/fastqc_untrimmed_reads/*.html" .
Understanding the Phred Quality Score
How the phred quality score makes sense in terms of accuracy:
Note on using zsh
If you are using zsh instead of bash (macOS, for example, changed the default recently to zsh), it is likely that a
no matches founderror will be displayed. The reason for this is that the wildcard (“*”) is not correctly interpreted. To fix this problem, the wildcard needs to be escaped with a “\”:
Now we can go to our new directory and open the 6 HTML files.
Depending on your system, you should be able to select and open them all at once via a right click menu in your file browser.
Exercise
Discuss your results with your group or a neighbour. Which sample(s) looks the best in terms of per base sequence quality? Which sample(s) look the worst?
Decoding the other FastQC outputs
We have now looked at quite a few “Per base sequence quality” FastQC graphs, but there are nine other graphs that we have not talked about! Below we have provided a brief overview of interpretations for each of these plots. For more information, please see the FastQC documentation here
- Per tile sequence quality: the machines that perform sequencing are divided into tiles. This plot displays patterns in base quality along these tiles. Consistently low scores are often found around the edges, but hot spots can also occur in the middle if an air bubble was introduced at some point during the run.
- Per sequence quality scores: a density plot of quality for all reads at all positions. This plot shows what quality scores are most common.
- Per base sequence content: plots the proportion of each base position over all of the reads. Typically, we expect to see each base roughly 25% of the time at each position, but this often fails at the beginning or end of the read due to quality or adapter content.
- Per sequence GC content: a density plot of average GC content in each of the reads.
- Per base N content: the percent of times that ‘N’ occurs at a position in all reads. If there is an increase at a particular position, this might indicate that something went wrong during sequencing.
- Sequence Length Distribution: the distribution of sequence lengths of all reads in the file. If the data is raw, there is often on sharp peak, however if the reads have been trimmed, there may be a distribution of shorter lengths.
- Sequence Duplication Levels: A distribution of duplicated sequences. In sequencing, we expect most reads to only occur once. If some sequences are occurring more than once, it might indicate enrichment bias (e.g. from PCR). If the samples are high coverage (or RNA-seq or amplicon), this might not be true.
- Overrepresented sequences: A list of sequences that occur more frequently than would be expected by chance.
- Adapter Content: a graph indicating where adapater sequences occur in the reads.
- K-mer Content: a graph showing any sequences which may show a positional bias within the reads.
Using MultiQC to Simplify the FastqC HTML output
It is hard to read through all html files at once. A great tool to make a summary of the QC files is multiqc. Remember to perform module load.
$ multiqc .
To customize the multiqc command please use flags such as -f to overwrite any existing reports or -o to specifiy an output location.
After running multiqc, please transfer your html file multiqc_report.html using scp to your local machine and examine the output file.
Exercise
Do any samples fail at least one of FastQC’s quality tests? What test(s) did those samples fail?
Extra Work Working with the FastQC text output ———————————–
Our .zip files are compressed files. They each contain multiple different types of output files for a single input FASTQ file. To view the contents of a .zip file, we can use the program unzip to decompress these files. Let’s try doing them all at once using a wildcard.
To unzip the files
$ unzip *.zip

$ for filename in *.zip
> do
> unzip $filename
> done
Let’s see what files are present within one of these output directories.
$ ls -F SRR2584863_FASTQC/
Use less to preview the summary.txt file for this sample.
$ cat SRR2584863_FASTQC/summary.txt
The summary file gives us a list of tests that FastQC ran, and tells us whether this sample passed, failed, or is borderline (WARN). Remember, to quit from less you must type q.
Other notes – optional
Quality encodings vary
Although we have used a particular quality encoding system to demonstrate interpretation of read quality, different sequencing machines use different encoding systems. This means that, depending on which sequencer you use to generate your data, a
#may not be an indicator of a poor quality base call.This mainly relates to older Solexa/Illumina data, but it is essential that you know which sequencing platform was used to generate your data, so that you can tell your quality control program which encoding to use. If you choose the wrong encoding, you run the risk of throwing away good reads or (even worse) not throwing away bad reads!
Same symbols, different meanings
Here we see
>being used as a shell prompt, whereas>is also used to redirect output. Similarly,$is used as a shell prompt, but, as we saw earlier, it is also used to ask the shell to get the value of a variable.If the shell prints
>or$then it expects you to type something, and the symbol is a prompt.If you type
>or$yourself, it is an instruction from you that the shell should redirect output or get the value of a variable.
Key Points
Quality encodings vary across sequencing platforms.
forloops let you perform the same set of operations on multiple files with a single command.
Adapted from the Data Carpentry Intro to Command Line -shell genomics https://datacarpentry.org/shell-genomics/
Licensed under CC-BY 4.0 2018–2022 by The Carpentries
Licensed under CC-BY 4.0 2016–2018 by Data Carpentry