Week 10 - Comparing Test and Control Groups with Differential gene expression (DGE) and Gene Ontology
Overview
Aims
- Understand how differential expression is calculte
- Understand what isoforms are being used as input to gene ontology analysis

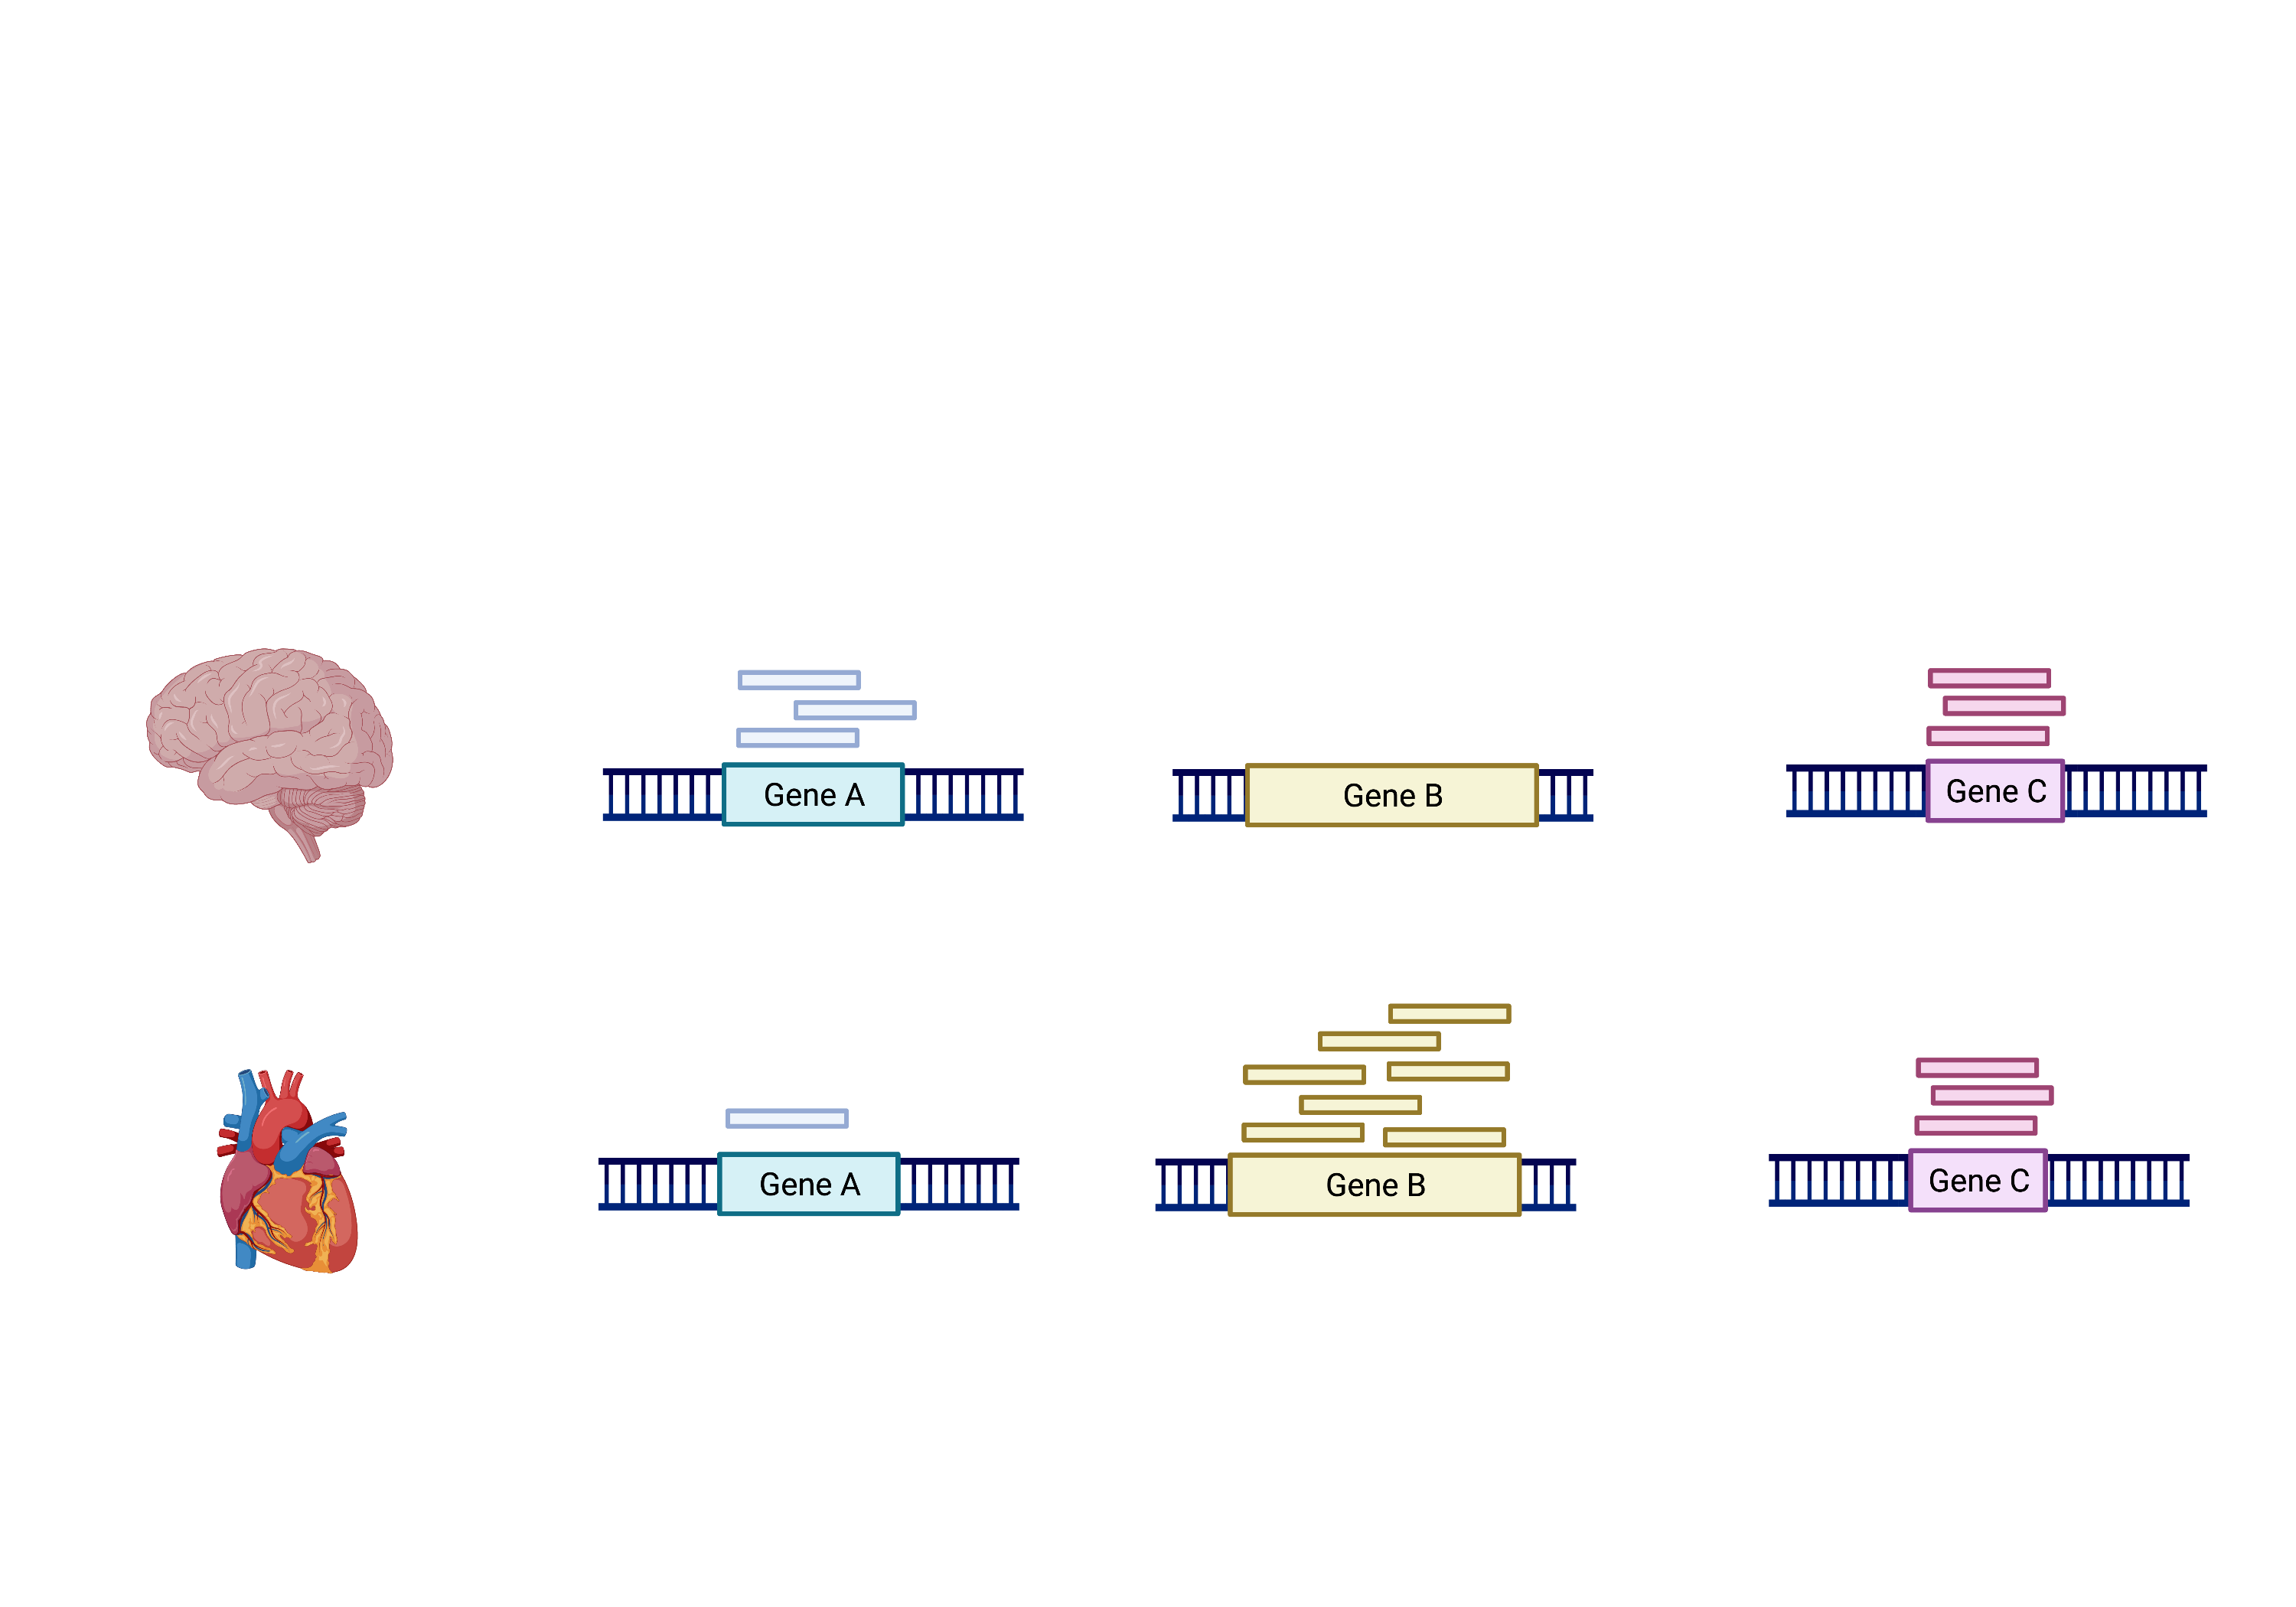
The schema above represents what has been calculated by Kallisto (except with transcripts). To summarise, the number of reads that map to a transcript in every sample across replciates in control (heart) and test (brain) groups. However, we need to calculate the comparisons between the two groups and determine which transcripts change significantly between conditions e.g. Gene A and Gene B, or not, e.g. Gene C.
This process is differential expression analysis. What is calculated at each stage includes:
- Reads
- CPM - counts per million
- Log fold change, p-value, FDR (false discovery rate)
This is performed by:
- Kallisto counts the number of reads that align to one transcript. This is the raw count, however, normalisation is needed to make accurate comparisons of gene expression between samples.
- Normalisation accounts for variabilities between or within raw counts due to technical differences such as read depth. The default in DEGUST is Counts per million (CPM). CPM accounts for sequencing depth. There are better normalisation methods for differential expression analysis between samples. However, we will not learn R in this course, so we must work with what we have. CPM (Counts Per Million) are obtained by dividing counts by the number of counts in the entire sample and multiplying the results by a million
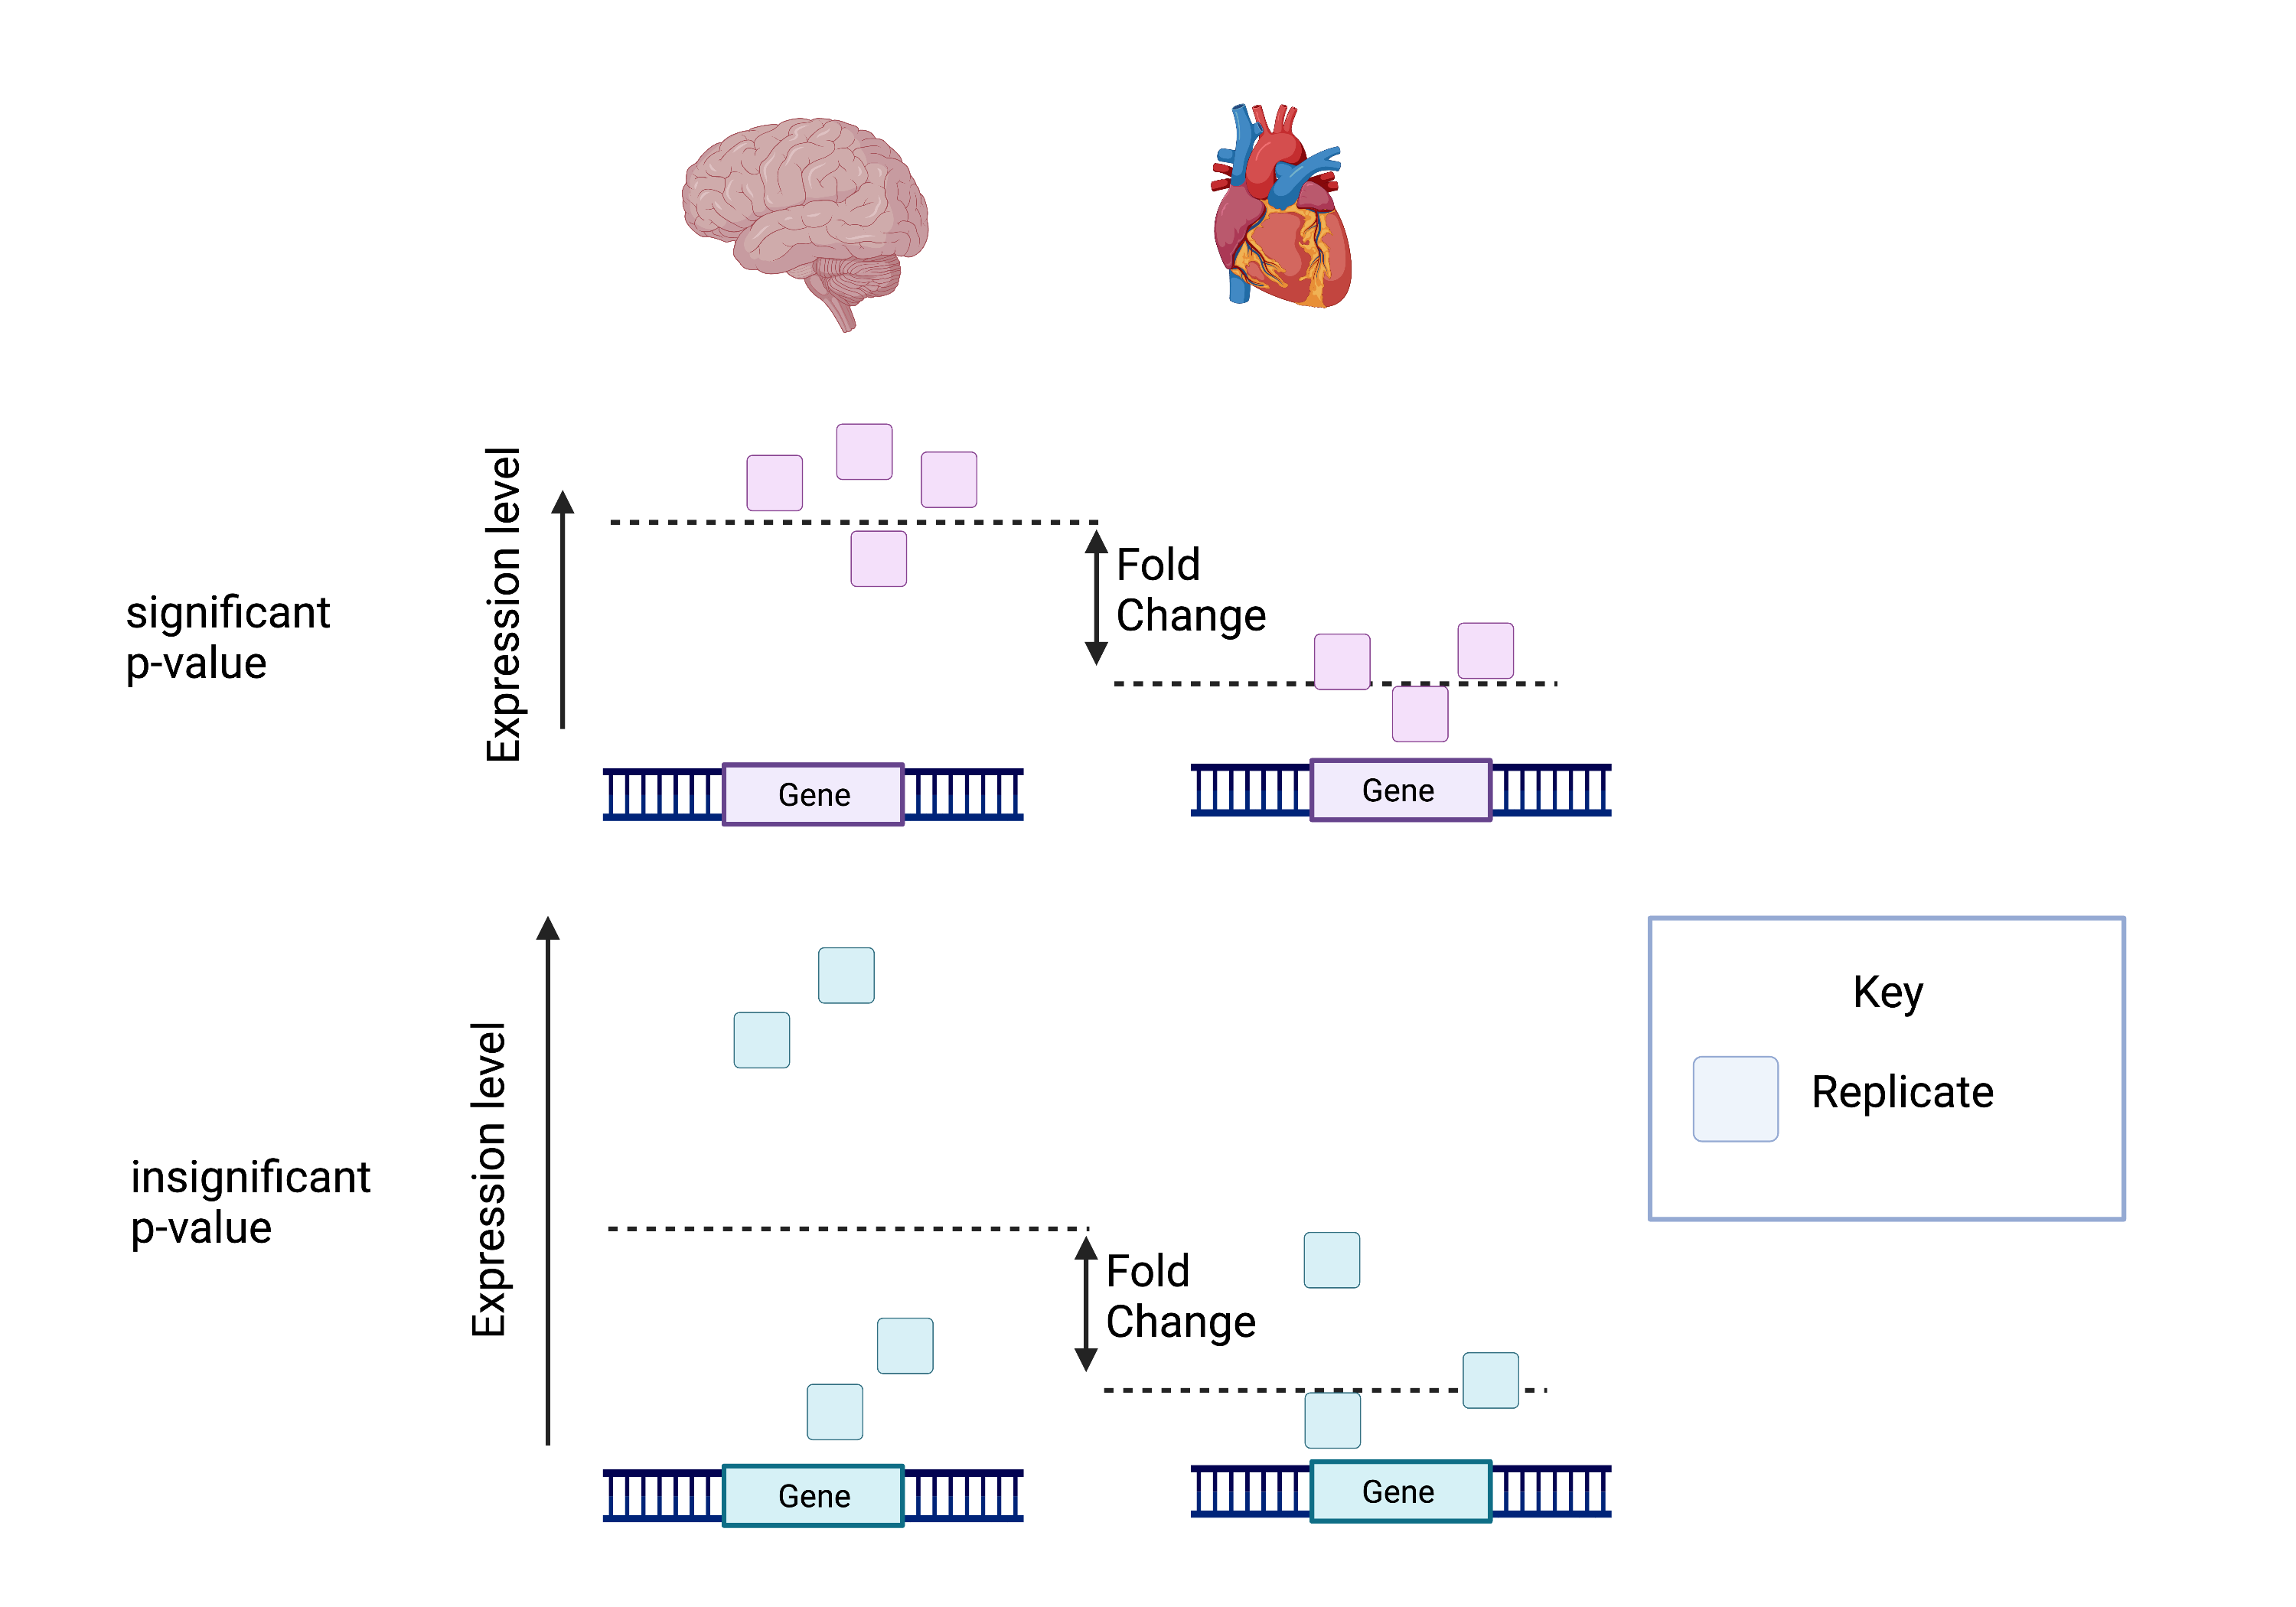
- Fold change is the change in CPM between conditions. Log Fold change is the logarithm of the fold change calculated. A positive fold change indicates an increase in expression, and a negative fold change indicates a decrease in expression between the control (heart) and test (brain). In my experiment, I expect the isoforms that regulate neuronal-related processes to be upregulated and the isoforms that regulate cardiac processes to be downregulated.
The picture attached shows that despite having the same log fold change, the lower p-value is correlated with lower intragroup variability.
This means we can be more certain that the difference in fold change is significant.

Calculating the FDR is essential as we test significance across hundreds of genes and samples. A certain number of these log fold change calculations could have occurred by chance. However, by calculating the FDR, we can confidently identify the isoforms with differential expression between the brain and cerebellum.
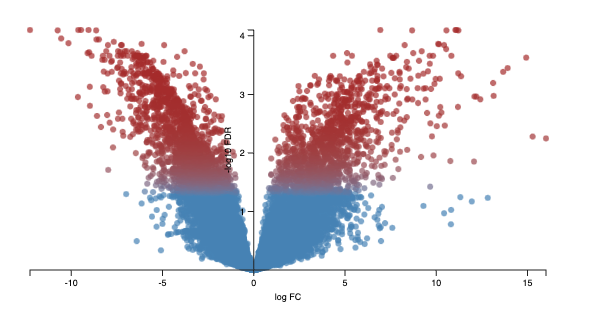
This is what is displayed in our DEGUST graphs.
Understanding in context to DEGUST Graphs
- Volcano plot - displays logFC on the x-axis against -log10FDR.
Calculating the negative logarithm of the FDR means the most significantly differentially expressed genes have a higher -log10FDR value.

- Parallel Coordinates - displays logFC
- Small Transcript plots in the right-hand corner- displays the CPM
Understanding in Context to Gene Ontology Graphs
The gene ontology graphs represent biological processes upregulated in the test (cerebellum) compared to the control (heart). The differentially expressed genes you identified using the parallel coordinates graph are included. Previously in week 9, I selected the top 100 or so isoforms for input into my GEO analysis. Again in my experiment, I expect the isoforms that regulate neuronal-related processes to be upregulated. These neuronal processes would be reflected in the GO terms enriched in my Manhattan plot outputted by GO: Profiler.
The other acronyms of database found on the x-axis of the manhatten plot are different, complementary databases or resources of molecular function:
- KEGG - (Kyoto encyclopedia of genes and genomes), which is useful to map the pathways usually to do with metabolism, human diseases, cellular processes.
- REAC- represents Reactome another database for biological pathways.
- HPA - the human protein atlas.
- MIRNA is miRTarBase
- WP is Wikipathways
- CORUM- comprehensive of mammalian protein complexes. Usually, the terms that are enriched are self-explanatory, e.g. CORUM:7586 FOXO1-ESR1 complex. This would represent an enrichment of genes that code for proteins within this complex.
- HP stands for Human Phenotype Ontology which is a database of disease related phenotypic abnormalities. So for each disease e.g. Marfan Syndrome you would have different annotations including HP:0001519 for disproportionate tall stature ect.